The Show Audio button will instruct DCP-o-matic to examine the audio in your content and plot a graph of its level over time. This can be useful for getting a rough idea of how loud the sound will be in the cinema auditorium. A typical plot is shown in Figure 7.4, “Audio plot”
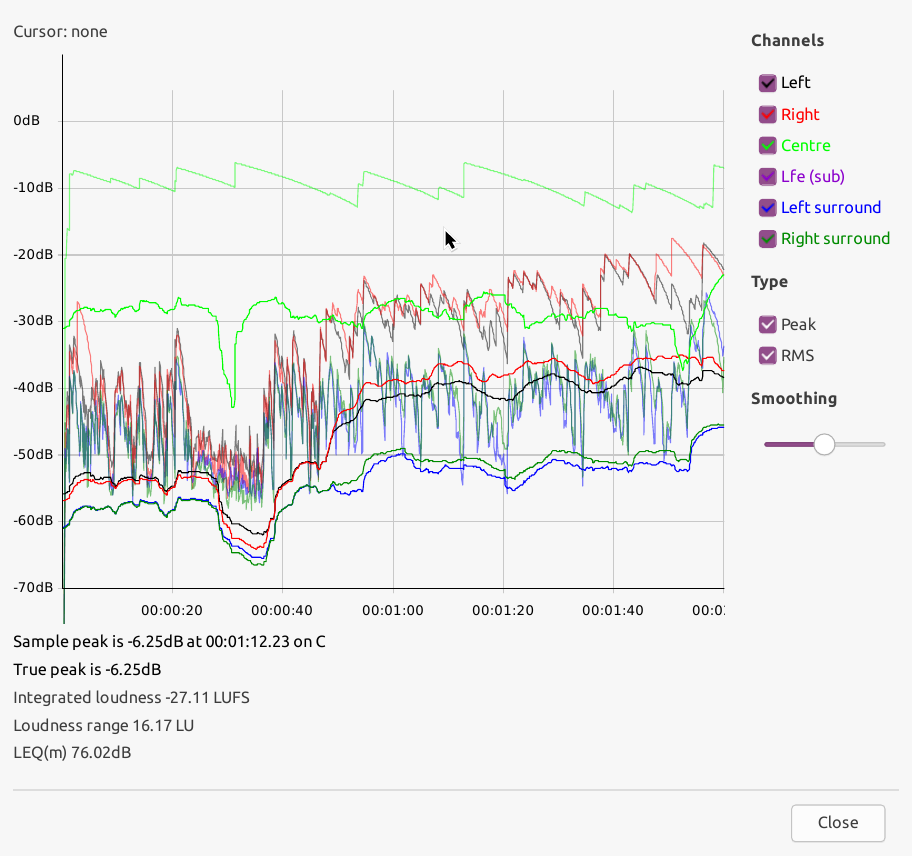
The plot gives the audio level (vertical axis, in dB) with time (horizontal axis). 0dB represents full scale, so if there is anything near this you are in danger of clipping the projector's audio outputs.
There are two plot types: the peak level and the RMS, which can be shown or hidden using the check-boxes on the right hand side of the window.
The channel check-boxes will show or hide the plot(s) for the corresponding channels in the DCP.
The smoothing slider applies a variable degree of temporal smoothing to the plots, which can make them easier to read in some cases.
Underneath the plot are shown some precise numbers for peaks and other measurements. A peak value displayed in red means that it is greater than -3dB.
The audio plot is no substitute for listening in an cinema, but it can be useful to get levels in roughly the right area.